WARNING
You are reading a documentation for an outdated version 1.3.
The up-to-date documentation for the latest version 1.4 is here.
Activity Chart Customization
Activity chart has an optimal layout by default which displays well on any device. However, you have several options how to customize it.
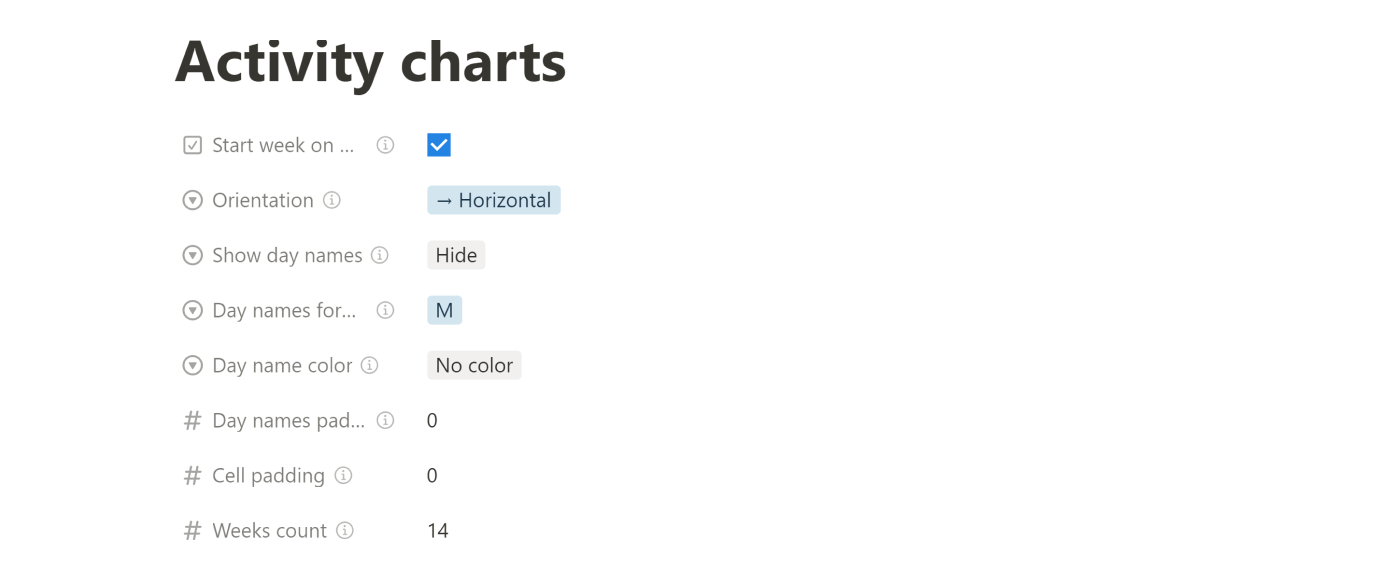
All the options are in Settings > Activity charts.

Orientation
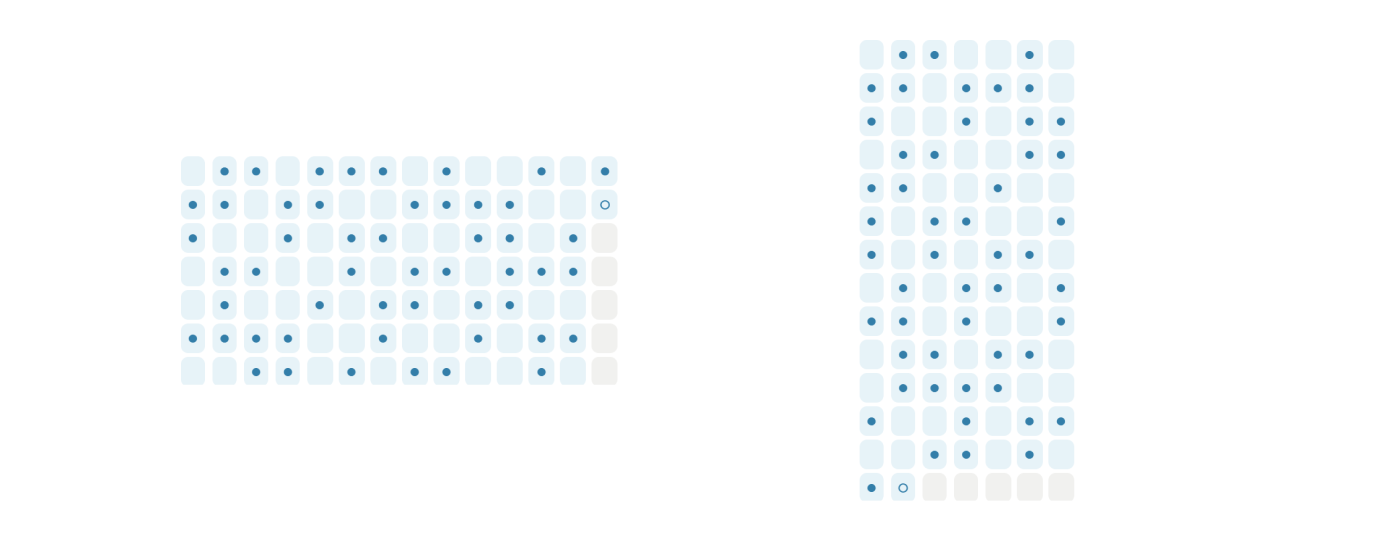
By default the chart is oriented horizontally, going from left to right. If you like it more you can set the vertical orientation which goes from top to bottom.

Color mode
You can choose from multiple color modes which affect how the habit's color is applied on its activity grid chart.

- Dots (default) - apply color to dots, cell background is gray
- Background - apply color to cell background, dots have the default color (red)
- Dots & Background (⚠ read bellow) - apply color to dots and cell background
WARNING
⚠ You've probably noticed that the images in the documentation display the Dots & Background mode. This is because this mode was the default one originally.
Unfortunately one of the Notion's updates introduced a change which broke this color mode so that the cells with a dot doesn't have the background color applied.

This is why I've integrated 2 new color modes to mitigate that issue.
I've discussed it with the Notion's support so they might fix it soon, I hope 🙏.
INFO
If you don't want to use colors at all (grayscale), use the Dots color mode and set habits colors to Gray.
Day names
The pure grid without day labels might seem confusing, you can turn them on. You can show then either at the start or at the end of the chart in both layout orientations. The text format at the day labels has two forms, short M or longer Mon for Monday. You can also set whether the day labels share the background color with the habit.

Padding
If you don't like the small squares, you can set the padding (number of spaces) around their content.

Weeks count
By default 14 latest weeks (including the current one) are shown. You can reduce or increase it.
WARNING
Be careful when increasing the number because it might break the chart on some screen widths. Check all your devices so that it displays correctly.
